Events
Chart events cover virtual data, custom formatting, custom drawing, interaction, persistence filtering, and adapter conversion. Prefer events when the chart needs dynamic behavior that cannot be expressed as static series or appearance settings.
Virtual Data Events
Use virtual data events when values remain outside the chart:
| Event | Use |
|---|---|
OnGetNumberOfPoints |
Return the number of points for a series. |
OnGetPoint |
Fill a virtual point record for the requested index. |
OnGetNumberOfAnnotations |
Return the number of annotations for a virtual point. |
OnGetAnnotation |
Fill a virtual annotation record. |
Handling these events switches the chart to virtual mode for the whole control — you do not add anything to the Series collection. OnGetNumberOfPoints and OnGetPoint are the minimum needed; add OnGetNumberOfAnnotations and OnGetAnnotation when virtual points should also carry annotations. The handler below serves five values from a plain array and annotates only the peak points:
{ ── Virtual data: serve points and annotations from your own storage ────── }
{ Handling these events enables virtual mode for the whole chart; no points  }
{ are added to the Series collection.                                        }
const
  PointValues: array[0..4] of Double = (12, 28, 31, 26, 37);

procedure TForm1.TMSFNCChart1GetNumberOfPoints(Sender: TObject;
  ASerie: TTMSFNCChartSerie; var ANumberOfPoints: Integer);
begin
  ANumberOfPoints := Length(PointValues);
end;

procedure TForm1.TMSFNCChart1GetPoint(Sender: TObject;
  ASerie: TTMSFNCChartSerie; AIndex: Integer;
  var APoint: TTMSFNCChartPointVirtual);
begin
  APoint.XValue := AIndex + 1;
  APoint.YValue := PointValues[AIndex];
  APoint.XValueText := Format('P%d', [AIndex + 1]);
end;

{ Annotate only the peak points whose value clears the threshold. }
procedure TForm1.TMSFNCChart1GetNumberOfAnnotations(Sender: TObject;
  ASerie: TTMSFNCChartSerie; APoint: TTMSFNCChartPointVirtual;
  var ANumberOfAnnotations: Integer);
begin
  if APoint.YValue > 30 then
    ANumberOfAnnotations := 1
  else
    ANumberOfAnnotations := 0;
end;

procedure TForm1.TMSFNCChart1GetAnnotation(Sender: TObject;
  ASerie: TTMSFNCChartSerie; APoint: TTMSFNCChartPointVirtual; AIndex: Integer;
  var AAnnotation: TTMSFNCChartAnnotationVirtual);
begin
  AAnnotation.Visible := True;
  AAnnotation.Text := Format('Peak: %.0f', [APoint.YValue]);
end;
See Series and points for a points-only virtual example with a screenshot.
Formatting Events
Assign OnGetSerieXValue to replace the calculated x-axis label text. Use it to convert numeric x-values into meaningful strings — dates, categories, or units.
| Event | Use |
|---|---|
OnGetSerieXValue |
Customize x-axis value text. |
OnGetSerieYValue |
Customize y-axis value text. |
OnGetSerieLabel |
Customize labels for collection-based points. |
OnGetSerieLabelVirtual |
Customize labels for virtual points. |
OnGetSerieLegendText |
Customize legend text. |
{ ── Formatting: custom x-axis labels from a date offset ─────────────────── }

procedure TForm1.TMSFNCChart1GetSerieXValue(Sender: TObject;
  ASerie: TTMSFNCChartSerie; AIndex: Integer;
  AKind: TTMSFNCChartDrawXYValueKind; AValue: Double;
  var AValueString: String);
var
  BaseDate: TDate;
begin
  BaseDate := EncodeDate(2024, 1, 1);
  AValueString := FormatDateTime('d mmm', BaseDate + AValue);
Drawing Events
Drawing events are paired as OnBeforeDraw... and OnAfterDraw... events. Use them to customize chart background, title, axes, grid lines, labels, legend items, bars, lines, markers, slices, and crosshair elements. Set custom stroke or fill properties in the before-draw handler and leave ADefaultDraw := True so the chart draws the styled element, or set it to False to take over completely.
Examples include OnBeforeDrawSerieLine, OnAfterDrawSerieMarker, OnBeforeDrawSerieSlice, and OnAfterDrawTitle.
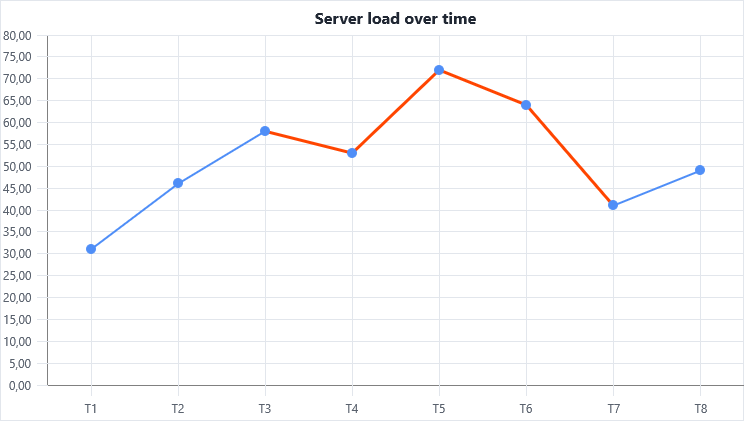
{ ── Drawing: colour a line segment above a threshold differently ──────────── }

procedure TForm1.TMSFNCChart1BeforeDrawSerieLine(Sender: TObject;
  AGraphics: TTMSFNCGraphics; ASerie: TTMSFNCChartSerie;
  var ADrawLine: TTMSFNCChartDrawLine; var ADefaultDraw: Boolean);
const
  Threshold = 50.0;
begin
  if Assigned(ADrawLine.StartReference)
    and (ADrawLine.StartReference.YValue > Threshold) then
  begin
    AGraphics.Stroke.Color := $FFFF6600;   { orange above threshold }
    AGraphics.Stroke.Width := 2.5;
  end
  else
  begin
    AGraphics.Stroke.Color := ASerie.Stroke.Color;
    AGraphics.Stroke.Width := ASerie.Stroke.Width;
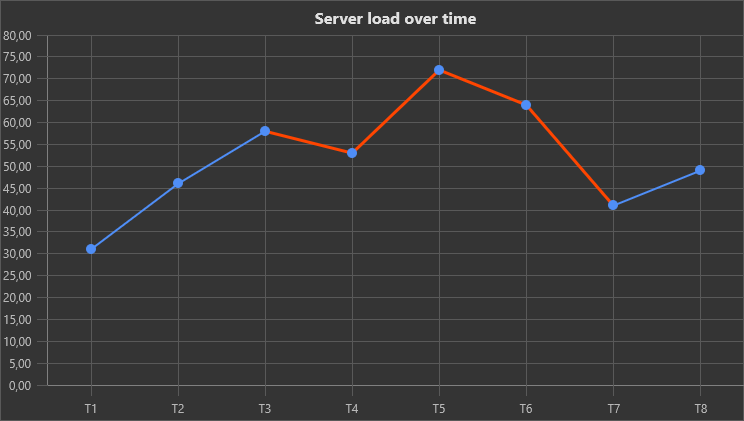
The handler above recolours each line segment whose start value is above a threshold, leaving the rest in the series' default stroke — the orange segments below are drawn entirely by the event:
Interaction Events
Use click and hit-test events to react to chart elements. OnSeriePointClick receives the TTMSFNCChartPoint that was clicked — read YValue, XValueText, and DataObject to display details or drive selection logic.
| Event | Use |
|---|---|
OnSeriePointClick |
A collection-based point was clicked. |
OnSeriePointClickVirtual |
A virtual point was clicked. |
OnSerieBarClick |
A bar was clicked. |
OnSeriesliceClick |
A pie or slice element was clicked. |
OnSerieAreaClick |
The filled body of an area or bar series was clicked. |
OnSerieAreaVirtualClick |
The filled body of a virtual-data series was clicked. |
OnLegendItemClick |
A chart legend item was clicked. |
OnTitleClick |
The title area was clicked. |
{ ── Interaction: respond to a point click ──────────────────────────────── }

procedure TForm1.TMSFNCChart1SeriePointClick(Sender: TObject;
  APoint: TTMSFNCChartPoint);
begin
  ShowMessage(Format('Series %d  X=%s  Y=%.2f',
    [APoint.Collection.Owner.Index,
     APoint.XValueText,
     APoint.YValue]));
end;
OnSeriePointClick reacts to a single point or bar, while OnSerieAreaClick reacts to a click anywhere on a series' filled body — useful for selecting or drilling into a whole area/bar series rather than one value. Its handler receives the TTMSFNCChartSerie that was hit; use the virtual variant when the series is driven by virtual-data events.
procedure TForm1.TMSFNCChart1SerieAreaClick(Sender: TObject;
  ASerie: TTMSFNCChartSerie);
begin
  // The older release note called this OnAreaClick; in the current API the
  // event is OnSerieAreaClick for collection-backed series.
  // Fires when the filled body of an area/bar series is clicked (not just a
  // point or bar). ASerie identifies which series was hit - select it, toggle
  // its visibility, or drill into its data.
  ShowMessage('Area clicked: ' + ASerie.LegendText);
end;
Persistence Events
Use OnCanSaveProperty and OnCanLoadProperty to keep specific properties out of persisted settings. Both handlers receive the property name and type and expose a var flag — set it to False to exclude the property. Mirror the same condition in both handlers so a property dropped on save is also ignored on load:
{ ── Persistence: keep runtime-only properties out of saved settings ──────── }
{ Return False from OnCanSaveProperty to drop a property from persisted state, }
{ and mirror it in OnCanLoadProperty so the same property is ignored on load.  }

procedure TForm1.TMSFNCChart1CanSaveProperty(Sender: TObject; AObject: TObject;
  APropertyName: string; APropertyType: TTypeKind; var ACanSave: Boolean);
begin
  if SameText(APropertyName, 'Name') then
    ACanSave := False;
end;

procedure TForm1.TMSFNCChart1CanLoadProperty(Sender: TObject; AObject: TObject;
  APropertyName: string; APropertyType: TTypeKind; var ACanLoad: Boolean);
begin
  if SameText(APropertyName, 'Name') then
    ACanLoad := False;
end;
Combining drawing and interaction events
Wire OnBeforeDrawSerieLine for threshold-based colour changes and OnSeriePointClick for point details simultaneously — they compose without conflict because each fires at a different phase of chart rendering and user input.
end;

{ ── Combined: threshold colouring + click info side-by-side ─────────────── }
{ Wire both OnBeforeDrawSerieLine and OnSeriePointClick to the same chart.   }
Related API
| API | Purpose |
|---|---|
TTMSFNCChart |
Event owner. |
TTMSFNCChartPoint |
Point data accessed in click events. |
TTMSFNCChartPointVirtual |
Virtual point data. |
TTMSFNCChartAnnotationVirtual |
Virtual annotation data. |