Timeline configuration
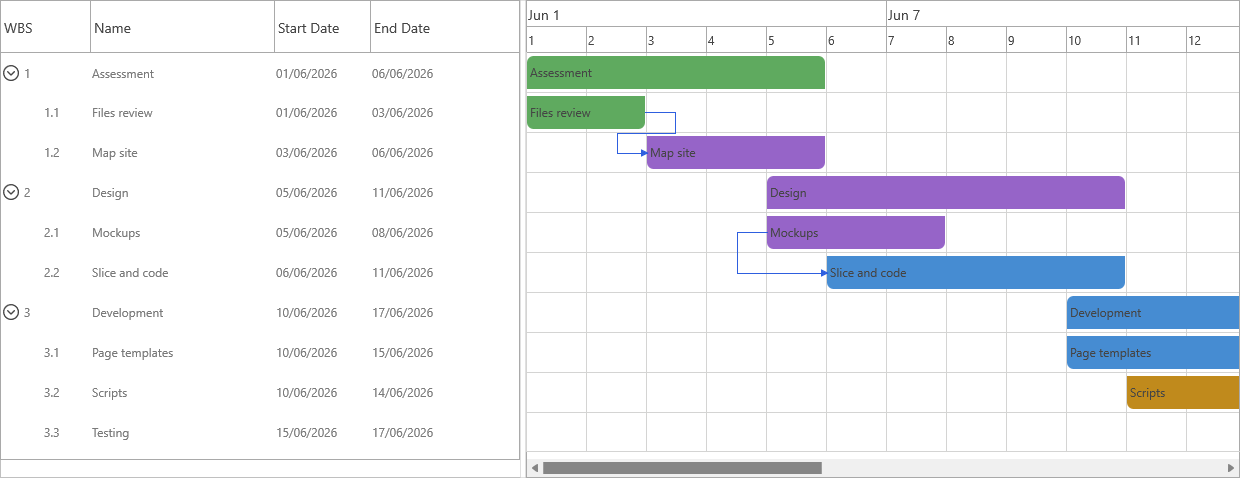
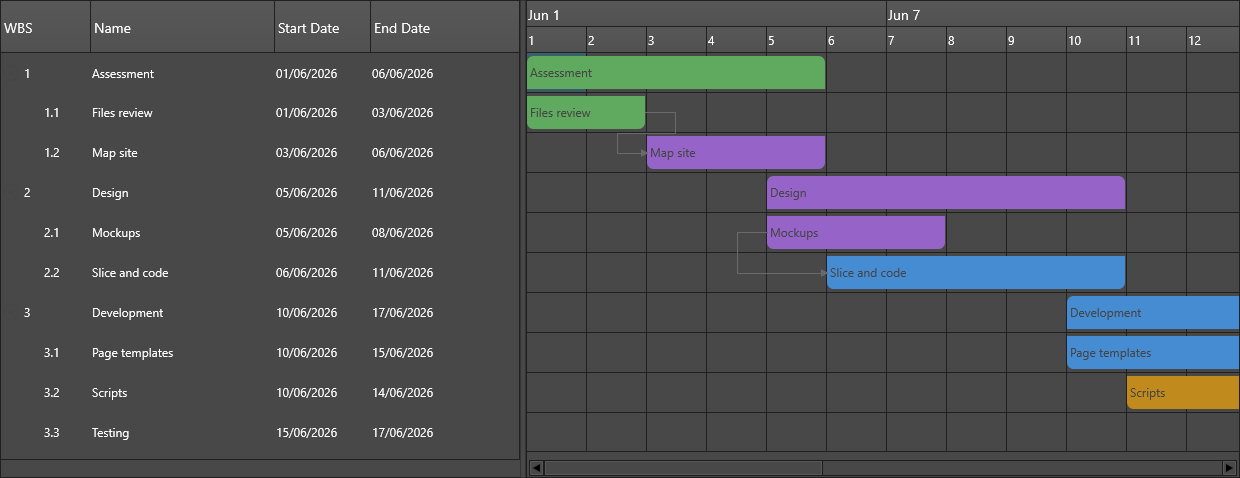
The timeline header has two tiers: a group tier (the coarser unit, e.g.
weeks) above a detail tier (the finer unit, e.g. days). Each tier has its own
unit, date-format string, and column span, letting you show, say, month names
over day numbers. Constrain the visible window with ViewDateStart/ViewDateEnd,
or leave both at 0 to auto-fit the tasks. ZoomTimeLine rescales the detail
cell width on the fly — pass 0 to auto-fit every item into the current view.
procedure TForm1.ConfigureTimeline;
begin
  TMSFNCGanttChart1.BeginUpdate;
  try
    { Top (group) tier: one cell per week, labelled by month and day. }
    TMSFNCGanttChart1.TimeLineOptions.GroupUnit := gtuWeek;
    TMSFNCGanttChart1.TimeLineOptions.GroupFormat := 'mmm d';
    TMSFNCGanttChart1.TimeLineOptions.ShowGroup := True;

    { Detail tier: one cell per day, labelled by day number. }
    TMSFNCGanttChart1.TimeLineOptions.TimeLineUnit := gtuDay;
    TMSFNCGanttChart1.TimeLineOptions.TimeLineFormat := 'd';
    TMSFNCGanttChart1.TimeLineOptions.TimeLineSpan := 1;

    { Constrain the visible window; leave both at 0 to auto-size to the tasks. }
    TMSFNCGanttChart1.TimeLineOptions.ViewDateStart := EncodeDate(2026, 6, 1);
    TMSFNCGanttChart1.TimeLineOptions.ViewDateEnd := EncodeDate(2026, 6, 30);
  finally
    TMSFNCGanttChart1.EndUpdate;
  end;

  { ZoomTimeLine scales the detail cell width; 0 auto-fits every item in view. }
  TMSFNCGanttChart1.ZoomTimeLine(1.5);
end;
void __fastcall TForm1::ConfigureTimeline()
{
  TMSFNCGanttChart1->BeginUpdate();
  try
  {
    // Top (group) tier: one cell per week, labelled by month and day.
    TMSFNCGanttChart1->TimeLineOptions->GroupUnit = gtuWeek;
    TMSFNCGanttChart1->TimeLineOptions->GroupFormat = "mmm d";
    TMSFNCGanttChart1->TimeLineOptions->ShowGroup = true;

    // Detail tier: one cell per day, labelled by day number.
    TMSFNCGanttChart1->TimeLineOptions->TimeLineUnit = gtuDay;
    TMSFNCGanttChart1->TimeLineOptions->TimeLineFormat = "d";
    TMSFNCGanttChart1->TimeLineOptions->TimeLineSpan = 1;

    // Constrain the visible window; leave both at 0 to auto-size to the tasks.
    TMSFNCGanttChart1->TimeLineOptions->ViewDateStart = EncodeDate(2026, 6, 1);
    TMSFNCGanttChart1->TimeLineOptions->ViewDateEnd = EncodeDate(2026, 6, 30);
  }
  __finally
  {
    TMSFNCGanttChart1->EndUpdate();
  }

  // ZoomTimeLine scales the detail cell width; 0 auto-fits every item in view.
  TMSFNCGanttChart1->ZoomTimeLine(1.5);
}
Timeline options
All timeline settings live under TTMSFNCGanttChart.TimeLineOptions:
| Property | Purpose |
|---|---|
TimeLineUnit / GroupUnit |
The detail and group units: gtuHour, gtuDay, gtuWeek, gtuMonth, gtuYear. |
TimeLineFormat / GroupFormat |
Date-format strings for each tier (e.g. 'd', 'mmm d', 'yyyy mm'). |
TimeLineSpan / GroupSpan |
How many units each cell combines. |
ShowGroup |
Whether the top (group) tier is drawn. |
ShowTrackLine |
Whether the current-time indicator line is drawn (default True). |
StartOfWeekDay |
First day of the week when the unit is gtuWeek (default gdSunday). |
ViewDateStart / ViewDateEnd |
The visible window; 0 means auto-size to the tasks. |
IsVisible |
Whether the timeline panel is shown at all. |
Choosing units and formats
Pick the detail unit to match task granularity (days for multi-week projects,
hours for same-day scheduling) and the group unit one step coarser for context.
The format strings follow standard Delphi date/time formatting, so 'mmm' yields
month names and 'd' day numbers. When you change TimeLineUnit, update
TimeLineFormat to a format that reads well at that scale.
Zooming
ZoomTimeLine(AZoomFactor) multiplies the detail cell width: values above 1
widen cells (more detail), values below 1 compress them. Passing 0 auto-fits
all items into the current viewport — useful for a "fit to window" command.
Putting it together
Set both tiers and their formats, constrain the visible window, and zoom — in one configuration routine:
procedure TForm1.ConfigureTimelineFully;
begin
  TMSFNCGanttChart1.BeginUpdate;
  try
    { Timeline options + choosing units and formats. }
    TMSFNCGanttChart1.TimeLineOptions.GroupUnit := gtuMonth;
    TMSFNCGanttChart1.TimeLineOptions.GroupFormat := 'mmmm yyyy';
    TMSFNCGanttChart1.TimeLineOptions.ShowGroup := True;
    TMSFNCGanttChart1.TimeLineOptions.TimeLineUnit := gtuWeek;
    TMSFNCGanttChart1.TimeLineOptions.TimeLineFormat := 'd';

    { Constrain the visible window. }
    TMSFNCGanttChart1.TimeLineOptions.ViewDateStart := EncodeDate(2026, 6, 1);
    TMSFNCGanttChart1.TimeLineOptions.ViewDateEnd := EncodeDate(2026, 7, 31);
  finally
    TMSFNCGanttChart1.EndUpdate;
  end;

  { Zooming: scale the detail cell width. }
  TMSFNCGanttChart1.ZoomTimeLine(1.25);
end;
void __fastcall TForm1::ConfigureTimelineFully()
{
  TMSFNCGanttChart1->BeginUpdate();
  try
  {
    // Timeline options + choosing units and formats.
    TMSFNCGanttChart1->TimeLineOptions->GroupUnit = gtuMonth;
    TMSFNCGanttChart1->TimeLineOptions->GroupFormat = "mmmm yyyy";
    TMSFNCGanttChart1->TimeLineOptions->ShowGroup = true;
    TMSFNCGanttChart1->TimeLineOptions->TimeLineUnit = gtuWeek;
    TMSFNCGanttChart1->TimeLineOptions->TimeLineFormat = "d";

    // Constrain the visible window.
    TMSFNCGanttChart1->TimeLineOptions->ViewDateStart = EncodeDate(2026, 6, 1);
    TMSFNCGanttChart1->TimeLineOptions->ViewDateEnd = EncodeDate(2026, 7, 31);
  }
  __finally
  {
    TMSFNCGanttChart1->EndUpdate();
  }

  // Zooming: scale the detail cell width.
  TMSFNCGanttChart1->ZoomTimeLine(1.25);
}
See also
- Task list columns and sorting — configure the left panel.
- Custom timeline drawing — override how cells and bars are painted.
TTMSFNCGanttChartAPI