Showing a trend
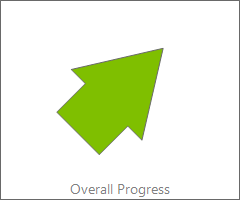
TTMSFNCWidgetArrow shows a single value as a tilting arrow — a compact trend or
direction indicator for a dashboard. You set Value as an angle and the arrow
points accordingly, optionally with a caption and a value readout. This chapter
covers pointing the arrow, the value text, and the caption.
Pointing the arrow
Value is a Single interpreted as an angle in the -90..+90 range: -90 tilts the
arrow one way, 0 points straight up, and +90 tilts it the other way. Map your
metric onto that range — the demo maps a 0..100% progress onto -90..+90 so the
arrow swings from "poor" to "good" as progress rises.
procedure TForm1.SetupArrow;
begin
  FArrow := TTMSFNCWidgetArrow.Create(Self);
  FArrow.Parent := Self;
  FArrow.SetBounds(20, 20, 220, 180);

  // Value is an angle in the -90..+90 range: the arrow tilts from down-left
  // (-90) through up (0) to down-right (+90), so higher reads as a better trend.
  FArrow.Value := 45;
  FArrow.CaptionOptions.Text := 'Overall Progress';
end;
The value readout and caption
ValueText shows text alongside the arrow — leave it blank to hide it, or set it
(or handle OnGetValueText) to show the underlying figure. CaptionOptions.Text
labels what the arrow represents, and ValueFont styles the value text.
Pitfalls
Valueis an angle, not a percentage. Map your data onto -90..+90 yourself; passing a raw 0..100 pins the arrow at one extreme.- Blank
ValueTexthides the readout. Set it or wireOnGetValueTextto show a number. - Keep the widget large enough. A small arrow with a long head can clip — tune the geometry in Styling the arrow.
See also
- Styling the arrow — color gradient and geometry.
- API reference — full class reference.