Legend, captions, and the funnel
Once the data is in place (see
Chart types and the value collection), the
distribution indicator gives you three framing elements that turn a bare chart
into a finished dashboard tile: a colour-keyed legend that maps colours to
labels, header and footer captions for a title and a note, and the
funnel geometry that shapes the dtFunnel presentation. Reach for these when
the chart will be read on its own — a legend removes guesswork about which colour
is which, captions give the tile a heading, and funnel tuning makes a
conversion story read clearly from top to bottom.
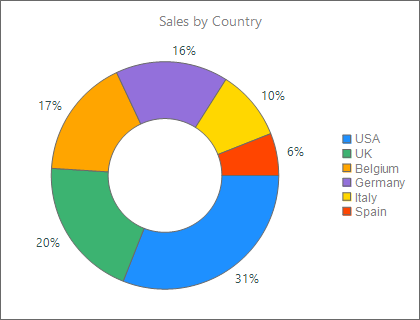
Positioning the legend
The legend lists each segment's colour next to its Text label. It is controlled
by the Legend options object:
Legend.Visible— show or hide the legend (defaultTrue).Legend.Position—lpLeft,lpTop,lpBottom, orlpRightrelative to the indicator (default below it).Legend.Font— the font used for the entries.
{ Place the legend to the right and enlarge its font: }
WidgetDistributionIndicator1.Legend.Visible := True;
WidgetDistributionIndicator1.Legend.Position := lpRight;
WidgetDistributionIndicator1.Legend.Font.Size := 12;
Choose the position from the chart shape: a tall funnel or a donut leaves room on
the right (lpRight), while wide bar presentations usually read better with the
legend on top or bottom.
Header and footer captions
Header and Footer are caption objects that draw text above and below the
indicator. Each exposes Text, Font, and Visible:
{ Title above, note below: }
WidgetDistributionIndicator1.Header.Text := 'Sales by Country';
WidgetDistributionIndicator1.Header.Font.Size := 16;
WidgetDistributionIndicator1.Header.Visible := True;

WidgetDistributionIndicator1.Footer.Text := 'Fiscal year 2025';
WidgetDistributionIndicator1.Footer.Visible := True;
When Visible is True the caption both draws and reserves layout space, so the
indicator area shrinks to make room — hide a caption you are not using so the
chart fills the tile.
Shaping the funnel
When DistributionType is dtFunnel, the Funnel options object controls the
taper. The widths are fractions of the available drawing width:
| Property | Meaning | Range / default |
|---|---|---|
Funnel.WidthTop |
Width of the top edge | 0.3–0.8, default 0.6 |
Funnel.WidthBottom |
Width of the bottom edge | 0–0.6, default 0.33 |
Funnel.Gap |
Vertical gap between sections | 0–0.04, default 0.02 |
Funnel.Sorted |
Order sections by descending value | default True |
A wider top and narrower bottom produces the classic funnel silhouette. Values outside the documented range are ignored, so the control never produces a degenerate shape.
Combining the funnel, captions, and legend
The snippet below ties all three framing elements together: it switches to the funnel presentation, tunes the taper, adds a header and footer, and moves the legend to the right — a complete, dashboard-ready configuration.
procedure TForm1.ConfigureFunnelView;
begin
  { Present the same Values collection as a conversion funnel. }
  WidgetDistributionIndicator1.DistributionType := dtFunnel;

  { Funnel geometry: relative widths of the top/bottom edges and the gap. }
  WidgetDistributionIndicator1.Funnel.WidthTop := 0.7;
  WidgetDistributionIndicator1.Funnel.WidthBottom := 0.25;
  WidgetDistributionIndicator1.Funnel.Gap := 0.02;
  WidgetDistributionIndicator1.Funnel.Sorted := True;

  { Header and footer captions frame the indicator. }
  WidgetDistributionIndicator1.Header.Text := 'Conversion Funnel';
  WidgetDistributionIndicator1.Header.Font.Size := 16;
  WidgetDistributionIndicator1.Header.Visible := True;

  WidgetDistributionIndicator1.Footer.Text := 'Q2 pipeline';
  WidgetDistributionIndicator1.Footer.Visible := True;

  { Move the colour-keyed legend to the right of the indicator. }
  WidgetDistributionIndicator1.Legend.Visible := True;
  WidgetDistributionIndicator1.Legend.Position := lpRight;
end;
Pitfalls
- Captions consume space. A visible
HeaderorFooterreduces the area left for the chart. Hide unused captions instead of leaving them with emptyText. - Funnel widths are fractions, not pixels.
WidthTop/WidthBottom/Gapare fractions of the drawing area; out-of-range values are silently ignored. Funnel.Sortedreorders sections only. It changes the draw order of funnel sections by descending value but does not alter the underlyingValuescollection — set it toFalseto preserve your insertion order.- Legend position and chart shape. A side legend (
lpLeft/lpRight) narrows the indicator; preferlpTop/lpBottomfor wide bar charts so the chart keeps its width.