Showing a KPI
TTMSFNCWidgetTrendIndicator is a KPI card: a large headline figure with a
description and a small trend graph of recent values. You set the value and a
description; the graph is covered in the next chapter. This chapter covers the
headline value and its formatting and label.
The headline value
Value is the figure shown large on the card — set it to the current metric (the
demo shows page views of 24358). ValueFont styles it, and ValueFormat
formats the number, for example to add thousands separators. Update Value as
the metric changes and the card redraws.
procedure TForm1.SetupTrend;
begin
  FTrend := TTMSFNCWidgetTrendIndicator.Create(Self);
  FTrend.Parent := Self;
  FTrend.SetBounds(20, 20, 280, 160);

  FTrend.Value := 24358; // the headline figure shown large
  FTrend.DescriptionText := 'Page Views, Product Catalog 1';
end;
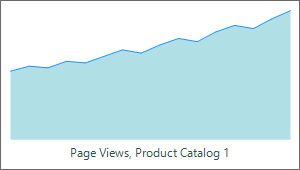
The description
DescriptionText is the caption under or beside the value that names the metric
('Page Views, Product Catalog 1'). DescriptionFont styles it. Use a concise
description so the card reads at a glance on a dashboard. OnGetValueText and
OnGetDescriptionText let you compute either text dynamically.
Pitfalls
Valueis the headline only. The graph is driven separately by theValuesseries — see The trend graph.ValueFormatcontrols the displayed number. Set it for large figures so they read with separators rather than as a raw integer.- Keep the description short. A long
DescriptionTextwraps and crowds the card.
See also
- The trend graph — populate and style the sparkline.
- API reference — full class reference.