Getting started
TTMSFNCGanttProject is the non-visual data container behind a Gantt chart. It
holds the task hierarchy, task dependencies, the work-time calendar (working
days, working hours, holidays), and task states, and it performs the scheduling
math that turns planned dates and durations into calculated start/end times. One
project can drive several TTMSFNCGanttChart controls at once, so the data lives
in one place and every chart stays in sync. This page sets up a project, connects
it to a chart, and adds a couple of scheduled tasks; the
Tasks & hierarchy,
Dependencies,
Work-time calendar, and
Persistence chapters go deeper.
Prerequisites
- TMS FNC Core installed and its runtime package referenced.
- TMS FNC Gantt Chart installed and its runtime package referenced.
Add the project and chart
- Drop a
TTMSFNCGanttProjectfrom the TMS FNC Gantt Chart palette page onto a form or data module. - Drop a
TTMSFNCGanttChartonto the form. - Assign the project to the chart's
Projectproperty:GanttChart1.Project := GanttProject1;
Note
The property on the chart is Project (type TTMSFNCGanttProject). A chart
also creates its own internal default project, so assigning your own project
replaces it. Assign the same project instance to several charts to keep them
synchronized.
Add tasks and a dependency
Build the project inside a BeginUpdate/EndUpdate pair so scheduling is
recalculated once. AddTask returns the created TTMSFNCGanttTask;
TaskDependencies.AddDependency links one task to another:
procedure TForm1.FormCreate(Sender: TObject);
var
  Design, Build: TTMSFNCGanttTask;
begin
  // One project instance drives the chart; assign it to the chart's Project.
  GanttChart1.Project := GanttProject1;

  GanttProject1.BeginUpdate;
  try
    GanttProject1.ProjectName := 'Website launch';
    GanttProject1.ClearTasks;

    // AddTask(AName, ADescription, AStartDate, ADurationValue, ADurationType, ...)
    Design := GanttProject1.AddTask('Design', 'Visual design',
      Now, 3, gdtWorkDays);
    Build := GanttProject1.AddTask('Build', 'Implementation',
      0, 5, gdtWorkDays);

    // Build starts when Design finishes.
    Build.TaskDependencies.AddDependency(Design, gtdFinishToStart);
  finally
    GanttProject1.EndUpdate;
  end;
end;
void __fastcall TForm1::FormCreate(TObject *Sender)
{
  TTMSFNCGanttTask *Design, *Build;

  // One project instance drives the chart; assign it to the chart's Project.
  GanttChart1->Project = GanttProject1;

  GanttProject1->BeginUpdate();
  try
  {
    GanttProject1->ProjectName = "Website launch";
    GanttProject1->ClearTasks();

    // AddTask(AName, ADescription, AStartDate, ADurationValue, ADurationType, ...)
    Design = GanttProject1->AddTask("Design", "Visual design",
      Now(), 3, gdtWorkDays);
    Build = GanttProject1->AddTask("Build", "Implementation",
      0.0, 5, gdtWorkDays);

    // Build starts when Design finishes.
    Build->TaskDependencies->AddDependency(Design, gtdFinishToStart);
  }
  __finally
  {
    GanttProject1->EndUpdate();
  }
}
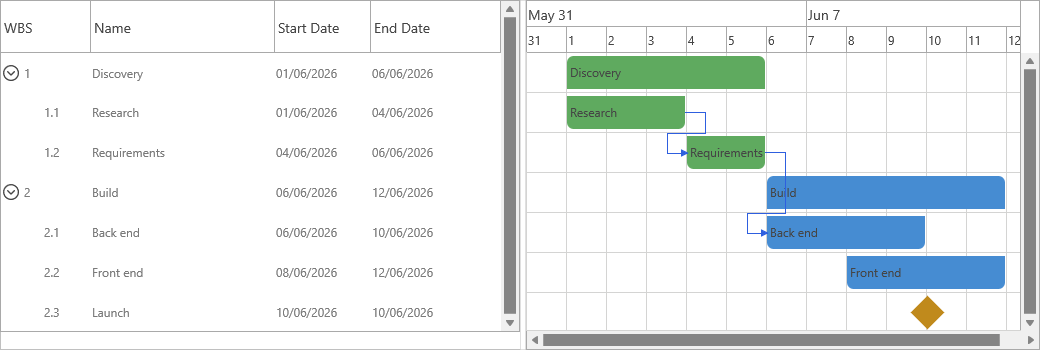
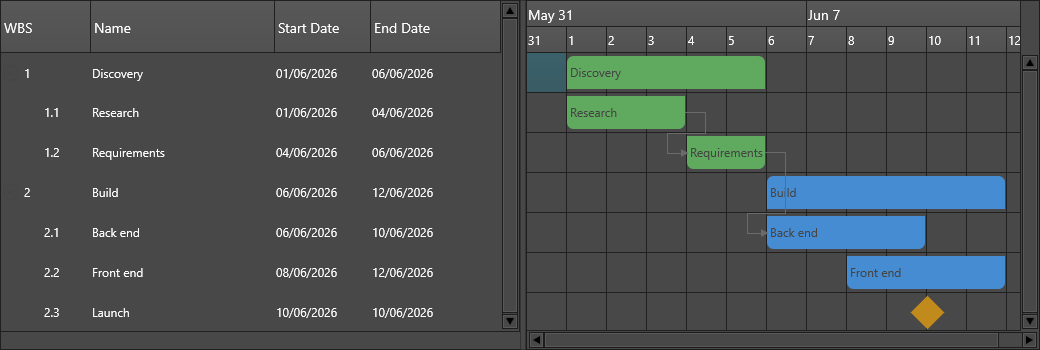
The chart renders the task list and timeline; the project owns the data. Read
calculated results back from each task's ScheduledStart and ScheduledEnd.
Next steps
- Tasks & hierarchy — add, nest, find, move, and lock tasks; event markers
- Dependencies — link tasks with the four dependency types and delays
- Work-time calendar — working days, working hours, and holidays
- Persistence — save and load projects as JSON